A falling click-through rate does not, by itself, mean your thumbnail has stopped working. Your overall CTR can decline when a larger share of impressions comes from a source with a lower CTR, even if performance within each source stays unchanged. Before replacing the thumbnail, separate a change in audience mix from a change in response.
This guide focuses on thumbnail impressions for long-form videos. It combines official metric definitions with an original, hypothetical calculation and a suggested review worksheet. It is not a report of a channel experiment, and the example percentages are not targets.
Start with the number CTR actually describes
YouTube's impressions CTR concerns views following registered thumbnail impressions. It varies with the audience and where the thumbnail appears. YouTube specifically notes that broader exposure, such as Home page impressions, can come with a lower rate. Its CTR FAQ also cautions against reacting to small fluctuations or judging results immediately after upload.
Not every route to a video creates a registered impression. External links, notifications and end screens are among the exclusions. Use the Impressions and how they led to watch time report for the associated funnel, rather than treating every public view as a thumbnail click. See YouTube's impressions documentation.
A worked example: lower CTR, more viewing
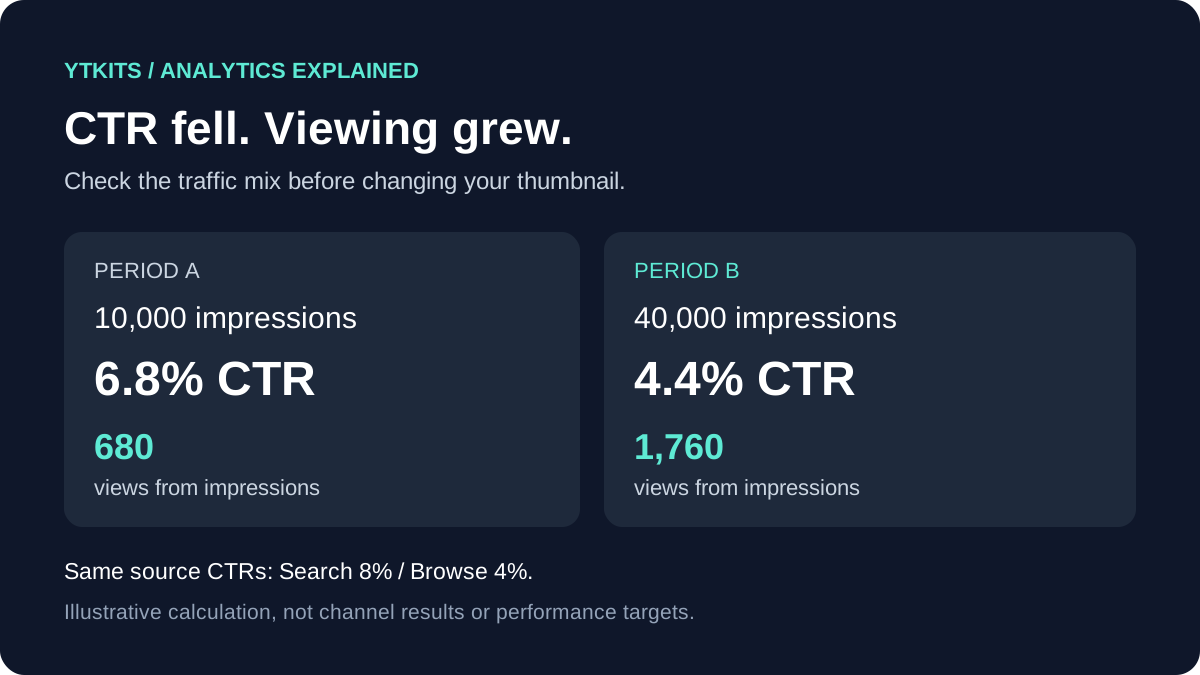
Imagine two equal-length reporting periods for the same video. To make the arithmetic easy to inspect, this hypothetical video has only two sources of registered impressions. Search stays at an 8% CTR and Browse stays at 4% in both periods.
| Period | Source | Impressions | CTR | Calculated views from impressions |
|---|---|---|---|---|
| A | YouTube Search | 7,000 | 8% | 560 |
| A | Browse features | 3,000 | 4% | 120 |
| A total | Both sources | 10,000 | 6.8% | 680 |
| B | YouTube Search | 4,000 | 8% | 320 |
| B | Browse features | 36,000 | 4% | 1,440 |
| B total | Both sources | 40,000 | 4.4% | 1,760 |
For each row, multiply impressions by the CTR expressed as a decimal. For each period, divide the sum of the resulting views by the sum of impressions:
- Period A: (560 + 120) / 10,000 × 100 = 6.8%.
- Period B: (320 + 1,440) / 40,000 × 100 = 4.4%.
The overall CTR falls 2.4 percentage points, yet calculated views from impressions rise by 1,080, or approximately 159%. Neither source's CTR deteriorated. Browse simply grew from 30% to 90% of the impression mix.
Do not average 8% and 4% to get the overall rate: that would give equal weight to sources with unequal impression counts. The combined CTR is weighted by impressions.
This calculation demonstrates a possible explanation, not a diagnosis of your channel. It assumes exact, unrounded inputs and matching reporting periods. Real Studio figures may be rounded, and the funnel can update at a different time from the headline metrics, as explained in YouTube's reporting notes.
Review your video before changing its packaging
The following is a suggested diagnostic routine, not a YouTube ranking formula.
1. Write down one question
Use a specific question such as: “Did fewer people choose this video within the same traffic source, or did the source mix change?” That gives you something you can investigate. “Is the algorithm against this upload?” does not.
2. Choose comparable reporting windows
Record the exact dates and use windows of equal length. Avoid comparing an incomplete day with a full week. If you compare different uploads, note their age, topic and duration; a video's launch period and its later search traffic are different contexts.
At the video level, open Analytics → Reach to inspect impressions. At the channel level, YouTube places these reports under Analytics → Content. These locations are documented in its impressions guide.
3. Separate the sources
Inspect the available traffic-source breakdown and record impressions and CTR where Studio provides them. Keep a missing metric blank instead of entering zero. Then ask whether the largest source changed and whether CTR fell inside that source.
If the total falls but the source-level rates stay similar, the worked example above gives you a plausible explanation. If Browse CTR also falls, the arithmetic alone no longer explains everything. You still need to investigate audience changes within Browse and the video's promise.
4. Check what happens after the click
Open the video's audience retention report. YouTube says retention data typically needs one to two days to process. Its intro metric describes the share still watching after 30 seconds, and dips can indicate skipping or leaving. See YouTube's retention guide.
Watch the opening yourself with the title and thumbnail in mind. If the packaging promises a quick repair but the opening spends a minute introducing the channel, write down that mismatch. This observation is more actionable than choosing a more dramatic thumbnail without checking what the video delivers.
5. Record a decision you can revisit
Use this compact worksheet for each review:
| Record | What to enter |
|---|---|
| Scope | Video, format, reporting dates and comparison dates |
| Distribution | Impressions and share by available traffic source |
| Response | Overall CTR and available source-level CTRs |
| Viewing | Views and watch time from impressions; retention observations separately |
| Context | Topic, publication age, promotions and packaging changes |
| Decision | Keep, investigate further, or test one specific change |
| Follow-up | Review date and the result that would change your decision |
Keep the report labels with the numbers. “Watch time from impressions” and total watch time describe different scopes; combining them without labeling the difference makes the review harder to interpret.
When would a thumbnail change make sense?
Use evidence to propose a change. Here are practical hypotheses, not automatic rules:
- The text is unreadable at small size: try a simpler design with one visible subject and fewer words.
- The promised outcome is unclear: make the outcome concrete, provided the video actually demonstrates it.
- The opening contradicts the promise: align the packaging with the content and plan a clearer opening for the next upload.
- Only the overall CTR fell while the source mix shifted: keep the current packaging as your baseline while investigating the breakdown.
Save the old title and thumbnail and record when you change them. A later increase is an observation, not proof that your edit caused it: the audience and distribution can change at the same time. YouTube flags this limitation in its CTR guidance.
For design considerations, see the YTKits thumbnail guide. For a broader review routine, read the YouTube analytics guide.
Can a public tool diagnose this for another channel?
This worksheet requires the channel's private Studio reports. A public view total and a visible thumbnail do not supply the impression counts and source-level CTRs needed to reproduce the calculation. Without those inputs, a competitor comparison cannot establish that its thumbnail converts better than yours.
If you document your own example, retain the metric labels, date ranges and traffic-source breakdown. Remove identifying information before sharing anything you want to keep private. Present observations separately from explanations you have not tested.
Sources and editorial method
Official documentation was checked on October 2, 2026. The linked YouTube pages support the metric definitions and reporting details. The table, arithmetic and worksheet are original explanatory material; they contain no private channel data or claimed experimental results. The article was drafted with AI assistance.
This article does not establish an ideal CTR or promise additional reach. For an error in the calculation or a changed Studio definition, use the YTKits corrections page and include the relevant section and source.