You've probably heard that finance channels earn more than gaming channels, but how much difference is there really?
While building the YTKits Revenue Estimator, I compared reported RPM ranges across YouTube categories. The result is an estimate model for exploring scenarios, not a measured market dataset.
In this guide, you can inspect the assumptions used by the YTKits calculator, understand why topic alone cannot determine RPM, and decide whether the ranges are suitable for your own scenario.
The Big Picture
While researching YouTube monetization and building the YTKits Revenue Estimator, I found repeated public reports of different RPMs across topics. Those reports were not collected with one consistent method, so they show why a range may be useful but do not measure the independent effect of a niche.
- Finance channels often have higher estimated RPMs than Gaming channels because advertisers in finance typically pay more for qualified audiences.
- Technology channels often command higher advertiser bids than Music channels, because advertisers selling software, electronics, and SaaS products typically pay more than entertainment advertisers.
The core reason comes down to two key metrics: CPM (Cost Per Mille) and RPM (Revenue Per Mille) .
| Metric | What It Means |
|---|---|
| CPM | The rate advertisers pay YouTube for every 1,000 ad impressions |
| RPM | Estimated creator revenue per 1,000 total video views |
Read our YouTube RPM vs CPM guide to learn more.
For standard long-form videos, YouTube takes a 45% cut of ad revenue and passes 55% to the creator, as outlined in the official YouTube Partner Program Overview. (Shorts flips this — creators get 45%, YouTube keeps 55%.)
Note: Your RPM isn't a simple 55% calculation of your CPM. CPM only measures views where an ad actually played. RPM accounts for all views — including ad-blocker viewers, non-monetized plays, or repeat watches where no ad displayed.
Because of this gap, a $5.00 CPM might yield a $2.75 maximum payout per 1,000 ad plays, but your actual RPM across all total views might land between $1.80 and $2.30.
What a $0.28 RPM Looks Like in Practice
(an illustrative India scenario, not a published national average)
| Views | Earnings |
|---|---|
| 1,000 | $0.28 |
| 10,000 | $2.80 |
| 100,000 | $28.00 |
| 1,000,000 | $280.00 |
Want to test a scenario? Run a channel URL through the YouTube Revenue Estimator and review the duration, category, and viewer-country assumptions before using the result.
Important: a video's category can describe its broad format, but it does not set a starting CPM. Advertiser demand, viewer location, topic, format, season, and the ads actually served all affect earnings. The ranges below are rough context, not rates promised by YouTube.
How I Built the RPM Estimate Model
| Research Variable | Details |
|---|---|
| Research Period | 2024–2026 |
| Source types reviewed | Public creator reports, third party advertising benchmarks, and YouTube documentation |
| Primary Region | India (with US/Tier-1 comparative baselines) |
| Tracked Metrics | Category, Audience Country, Video Duration, CPM, RPM |
| Purpose | Create adjustable RPM assumptions for scenario planning |
When I started building the YTKits Revenue Estimator, I thought the hardest part would be calculating YouTube earnings. The formula itself wasn't the challenge — I already understood how YouTube monetization, CPM, and RPM worked. What I wasn't confident about was assigning realistic RPM values to different YouTube categories.
To understand how other tools handled this, I tested several popular YouTube revenue calculators and estimators. One thing quickly stood out: most of them relied on generic flat RPM values applied to almost every channel. Very few considered the channel's category, audience country, or video duration — all of which can significantly impact earnings.
So instead of using one generic value, I compared publicly reported creator earnings, advertising benchmarks, and RPM discussions by category, duration, country, and content type. My goal was to build working assumptions for scenario planning and understand why RPM varies from channel to channel.
Methodology limitation: these figures are working estimates assembled from public creator reports and third party advertising benchmarks, not an official YouTube export or a statistically representative sample. I did not publish a source-level dataset that lets readers reproduce every category value. Read the tables as assumptions used by the YTKits estimator, not measured market averages; the second decimal place comes from the model and should not be interpreted as precision.
Working observation: public reports for topics such as finance, software and business often showed higher ranges. Those reports may also involve different countries, formats and audiences, so this article does not claim that topic alone caused the difference. A YouTube category label does not set the rate.
Channels within the same category can still report very different RPM values. That is why the estimator presents a range and lets users change the category and country assumptions instead of claiming a single rate.
Building an AI Category Predictor
While researching YouTube RPM, I noticed another interesting problem: many creators manually selected broad YouTube categories that didn't accurately describe the videos they were publishing.
Since my Revenue Estimator depends on category-specific RPM ranges, I built a machine learning model that predicts the most relevant YouTube category from a video's metadata.
How My Category Tool Works
┌─────────────────────────────────────────┐
│      Paste Video or Channel URL         │
└────────────────────┬────────────────────┘
                      │
                      ▼
┌─────────────────────────────────────────┐
│  1. Extract Metadata Category           │
│  - Reads creator's self-selected tag    │
└────────────────────┬────────────────────┘
                      │
                      ▼
┌──────────────────────────────────────────────────────────┐
│  2. ML Classification Pipeline                            │
│  - Analyzes video title, tags & content                   │
│  - Predicts the most relevant YouTube category based on   │
│    video metadata and content signals                     │
└─────────────────────┬───────────────────────────────────┘
                      │
                      ▼
┌─────────────────────────────────────────┐
│  Output: Declared vs. Predicted Match % │
└─────────────────────────────────────────┘
Figure 1. AI Category Predictor comparing the creator-selected category with the model's predicted category.
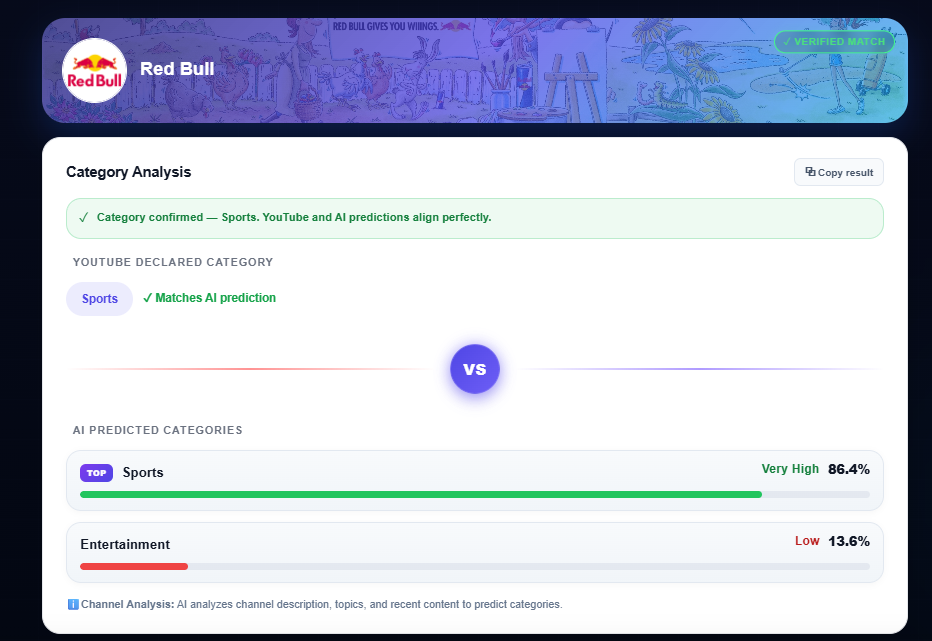
Compare a video's public YouTube category with YTKits' separate topic estimate using the YTKits Category Checker. This comparison does not reveal YouTube's internal recommendation classification.
When you analyze a video or channel using YTKits, you'll see two values:
- Creator-selected category
- AI-predicted category
The AI prediction provides an independent estimate of the video's category based on its metadata. Comparing it with the creator-selected category can help identify differences in how content may be interpreted — but it does not reflect YouTube's internal recommendation or classification systems.
Why Video Duration & Sub-Niches Change the Game
Category alone doesn't tell the whole story. Two videos in the exact same category can have wildly different RPMs depending on video duration and sub-niche targeting.
- The 8-Minute Threshold — Per YouTube's mid-roll ad guidelines, videos that reach or exceed 8 minutes can include mid-roll ads. Doubling or tripling potential ad impressions on a single view often causes RPMs to jump significantly.
- Sub-Niche Intent — Broad educational videos (like high school math) draw basic consumer ads. But structured coding bootcamps, developer tools, or career coaching attract enterprise software and B2B advertisers — driving RPMs much higher, despite both being tagged "Education."
Turning the Research into a Tool
To make sense of these overlapping variables, I compiled a dataset of creator earnings, monetization reports, and category ad trends. That research evolved into the YTKits Revenue Estimator.
Rather than applying one fixed RPM to every channel, the estimator adjusts calculations based on detected category, audience country, and video duration.
My Revenue Checker Tool Workflow
┌─────────────────────────────────────────┐
│      Paste Video or Channel URL         │
└────────────────────┬────────────────────┘
                      │
                      ▼
┌─────────────────────────────────────────┐
│  1. Metadata Extraction                  │
│  - Declared Category                     │
│  - Audience/Channel Country              │
│  - Video Duration (or Channel Avg)       │
│  - View Count                            │
└────────────────────┬────────────────────┘
                      │
                      ▼
┌─────────────────────────────────────────┐
│  2. Dynamic Localized RPM Calculator     │
│  - Category baseline RPM mapping         │
│  - Country                               │
│  - 8+ Min mid-roll or less than 8 min    │
└────────────────────┬────────────────────┘
                      │
                      ▼
┌─────────────────────────────────────────┐
│  Output: Conditional Revenue Scenario   │
└─────────────────────────────────────────┘
Figure 2. Revenue Estimator using category, country, and video duration to estimate earnings.

The screenshot above shows the estimator applying its internal RPM assumptions to public channel data. It does not show the channel's actual earnings.
Evidence note: YouTube does not publish category RPM baselines. These ranges are internal scenario assumptions assembled from public creator reports and third-party discussions with different methods. They are not verified benchmarks or measured India-wide averages.
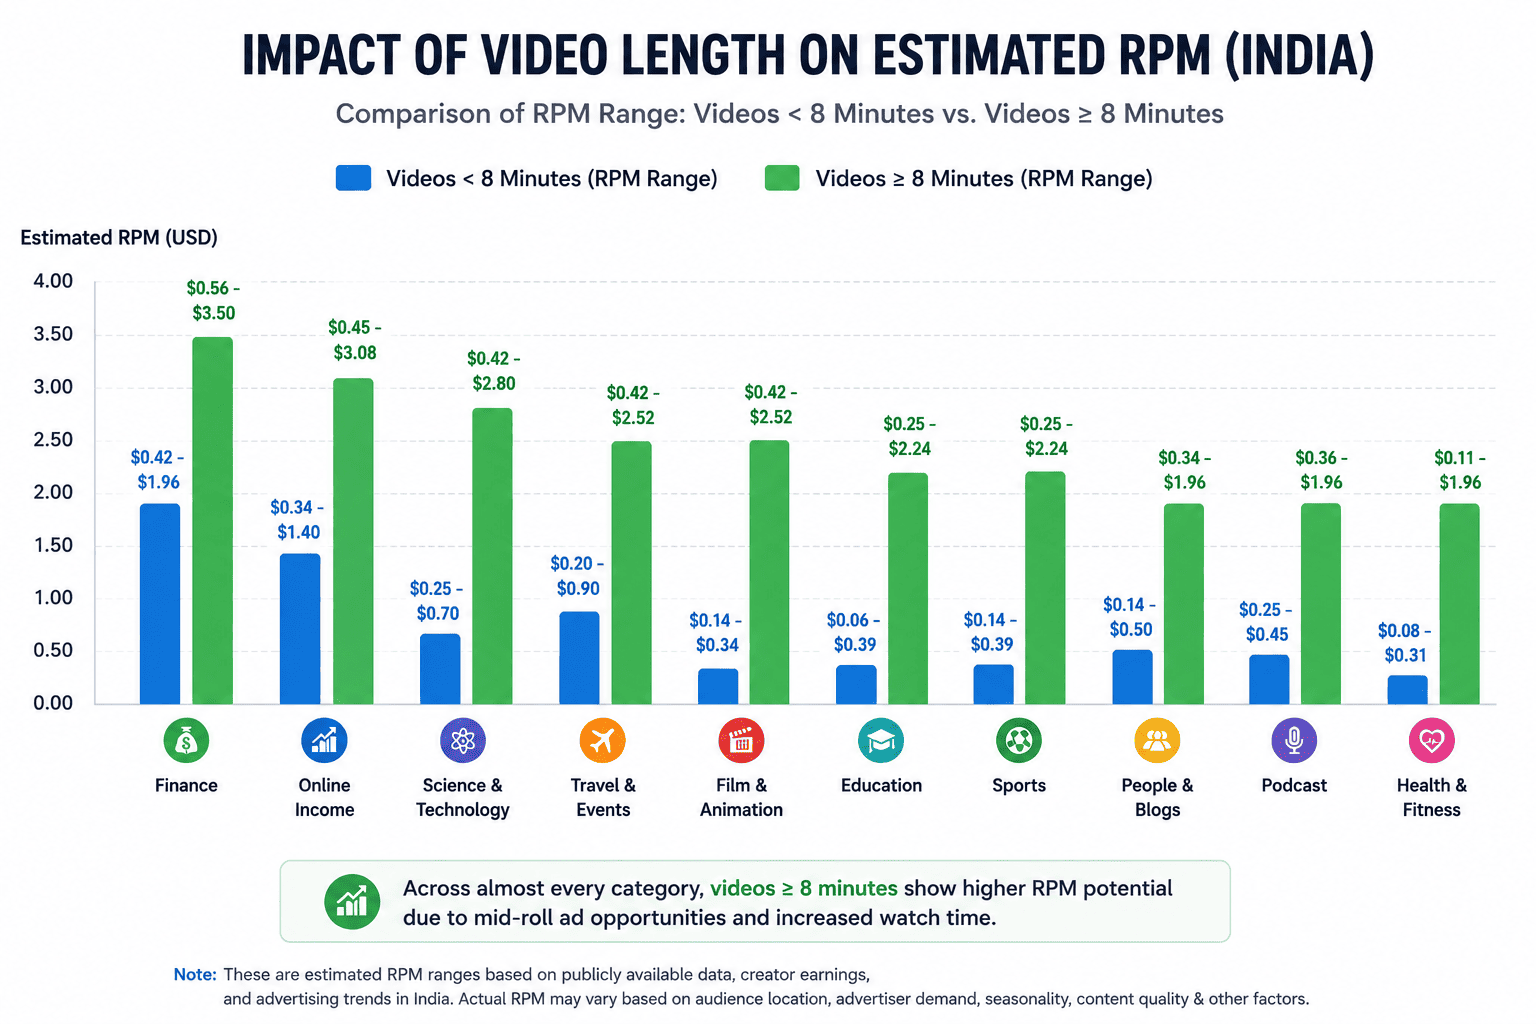
Estimated YouTube RPM by Category in India (2026 Research)
Model scope
- Country: India
- Illustrative CPM baseline: ~$0.70
- Illustrative RPM baseline: ~$0.28
- Basis: Working India assumptions used while developing the YTKits Revenue Estimator
All figures in the table below are specific to an Indian audience. Later in this article, the category deep-dive tables (Finance, Tech, Entertainment) use CPM data sourced from broader, largely US/global creator reports — those numbers are naturally higher and aren't directly comparable to the India-only figures here. Each section notes which audience the numbers reflect.
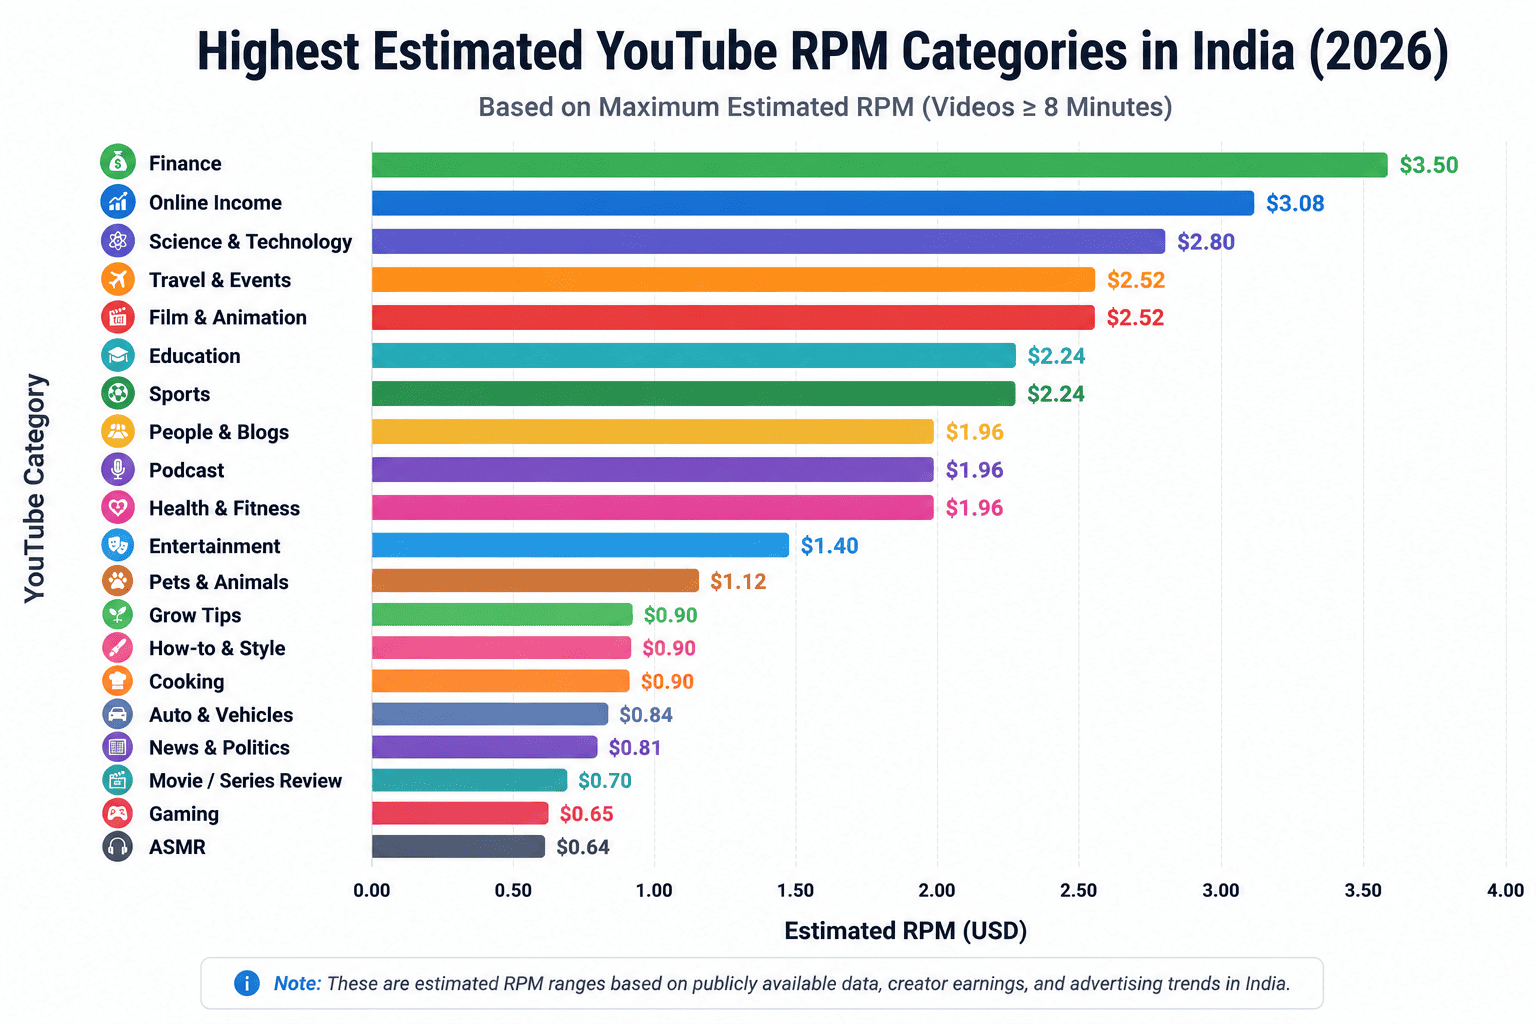
| Category | Country | Videos < 8 Min | Videos ≥ 8 Min | RPM Tier |
|---|---|---|---|---|
| Finance | India | $0.42 – $1.96 | $0.56 – $3.50 | Premium |
| Online Income | India | $0.34 – $1.40 | $0.45 – $3.08 | Premium |
| Science & Technology | India | $0.25 – $0.70 | $0.42 – $2.80 | High |
| Travel & Events | India | $0.20 – $0.90 | $0.42 – $2.52 | High |
| Film & Animation | India | $0.14 – $0.34 | $0.20 – $2.52 | High |
| Education | India | $0.06 – $0.39 | $0.25 – $2.24 | High |
| Sports | India | $0.14 – $0.39 | $0.25 – $2.24 | High |
| People & Blogs | India | $0.14 – $0.50 | $0.34 – $1.96 | Medium |
| Podcast | India | $0.25 – $0.45 | $0.36 – $1.96 | Medium |
| Health & Fitness | India | $0.08 – $0.31 | $0.11 – $1.96 | Medium |
| Entertainment | India | $0.22 – $0.56 | $0.39 – $1.40 | Medium |
| Pets & Animals | India | $0.06 – $0.25 | $0.14 – $1.12 | Moderate |
| Grow Tips | India | $0.14 – $0.42 | $0.36 – $0.90 | Moderate |
| How-to & Style | India | $0.11 – $0.36 | $0.20 – $0.90 | Moderate |
| Cooking | India | $0.11 – $0.36 | $0.20 – $0.90 | Moderate |
| News & Politics | India | $0.11 – $0.36 | $0.22 – $0.81 | Moderate |
| Auto & Vehicles | India | $0.06 – $0.25 | $0.14 – $0.84 | Moderate |
| Gaming | India | $0.11 – $0.34 | $0.22 – $0.65 | Moderate |
| Movie / Series Review | India | $0.20 – $0.39 | $0.25 – $0.70 | Low |
| ASMR | India | $0.11 – $0.31 | $0.17 – $0.64 | Low |
How I Classified the RPM Tiers
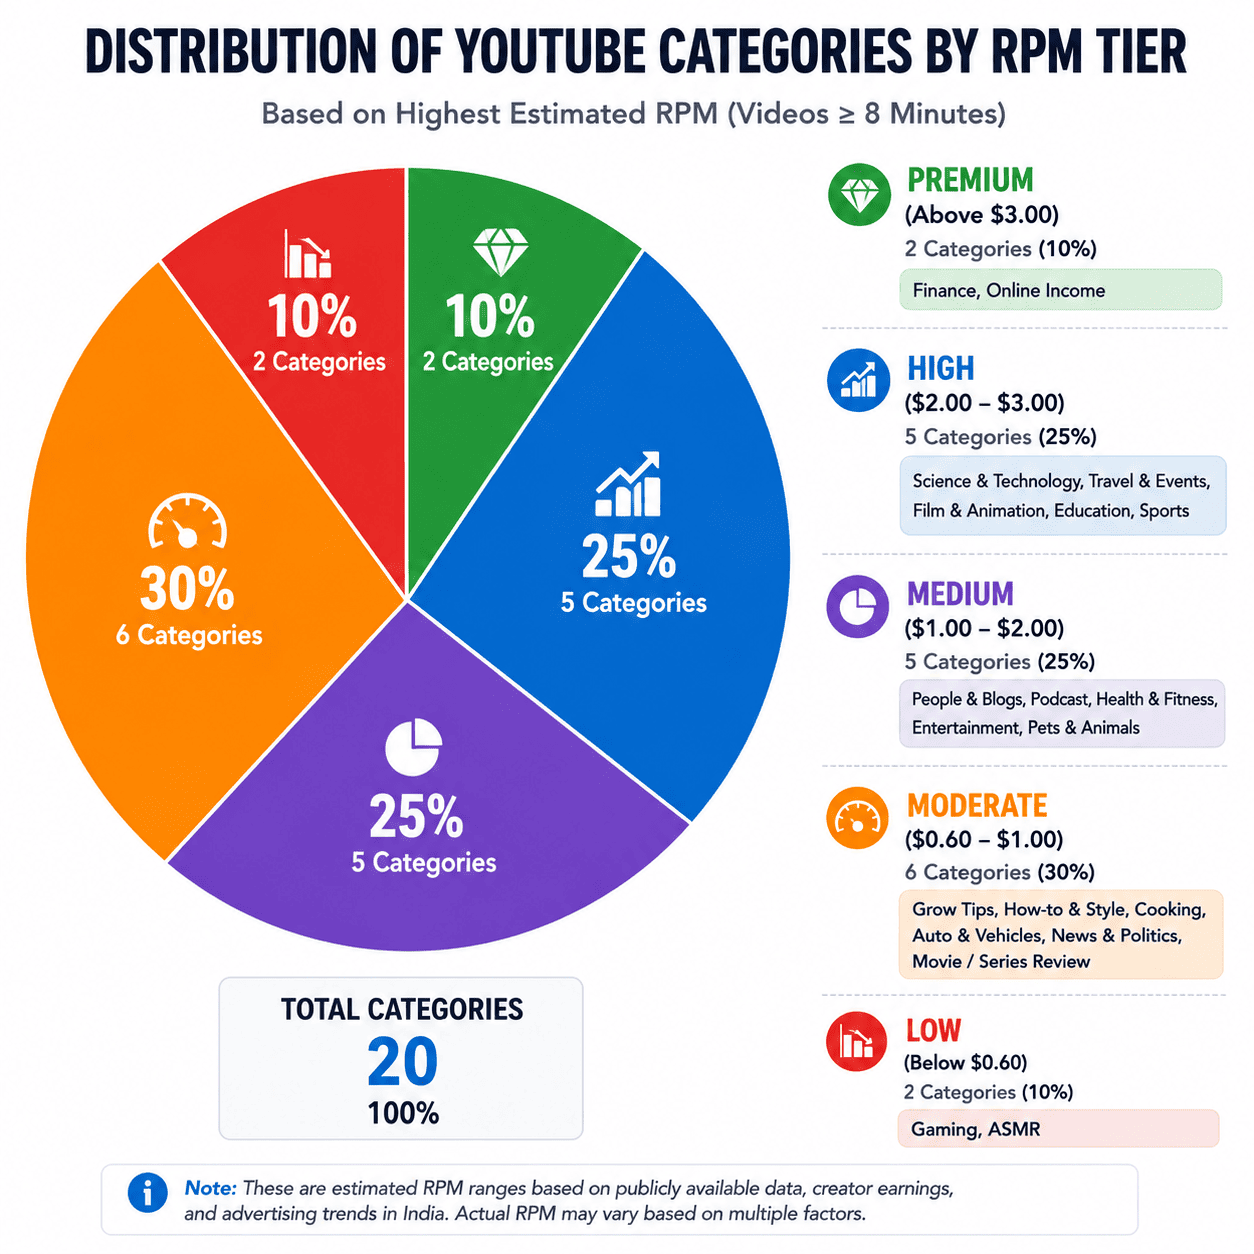
I grouped each category according to the upper estimated RPM bound used in the model.
| RPM Tier | Maximum Estimated RPM |
|---|---|
| Premium | Above $3.00 |
| High | $2.00 – $3.00 |
| Medium | $1.00 – $2.00 |
| Moderate | $0.60 – $1.00 |
| Low | Below $0.60 |
Key Findings
- Finance had the highest estimated RPM in my Indian dataset, reaching up to $3.50 on videos longer than 8 minutes.
- Online Income and Science & Technology consistently ranked among the strongest categories for advertiser demand.
- Videos longer than 8 minutes generally showed higher RPM, since they can include mid-roll ads.
- Gaming and Entertainment attract large audiences, but their RPM is usually lower than Finance or Technology.
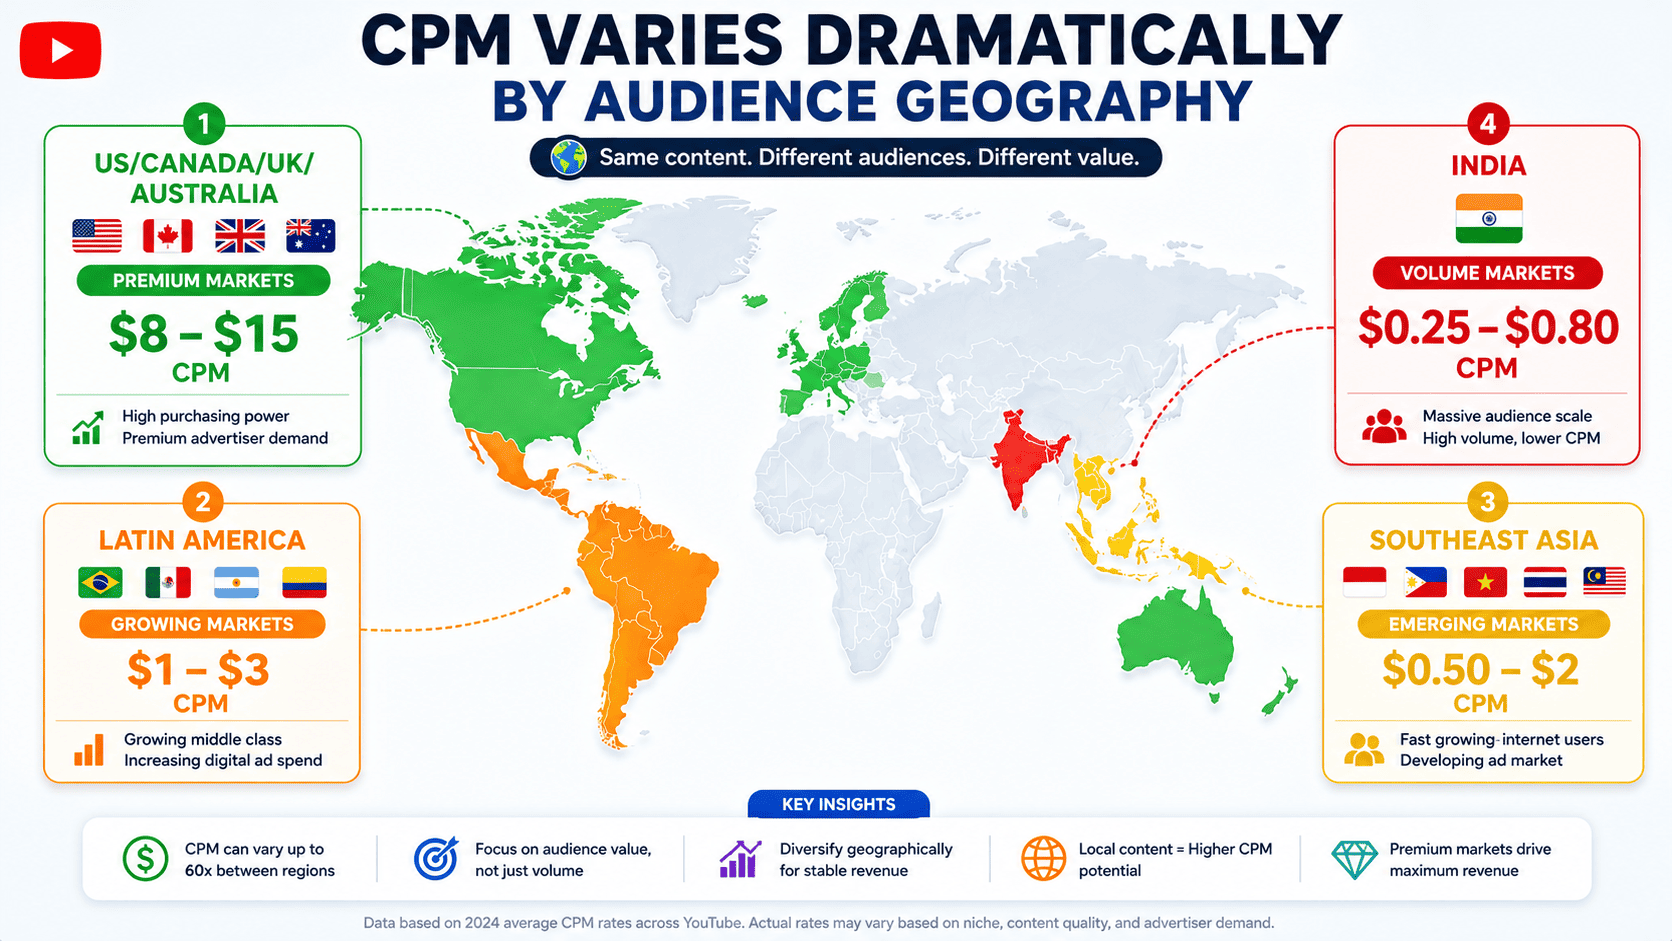
- Audience geography remains one of the biggest factors affecting RPM — channels targeting the US, Canada, or the UK often earn considerably higher RPM than channels focused primarily on India.
Why CPM Varies So Much Between Categories
Factor 1 — Audience Purchasing Power
- Commercial intent: Some finance, business, and software topics attract advertisers selling higher-value products, which can increase competition for suitable ad inventory.
- Audience and format differences: Entertainment, music, and family content can have different advertiser demand, viewer locations, formats, and ad-suitability constraints.
Factor 2 — Advertiser Competition
- Advertiser competition changes by topic, audience, season, format, and campaign goal. Category alone does not determine the auction price.
Factor 3 — Geographic Audience
| Audience Region | CPM Range | Why |
|---|---|---|
| US/UK/Canada/Australia | $5 – $15 | Wealthy, English-speaking, ad-responsive |
| Latin America/Southeast Asia | $0.50 – $2 | Lower purchasing power |
| India | $0.25 – $0.80 | Large population but low ad spend |
For an advertiser-side view of how CPM varies by industry (as opposed to the creator-side RPM figures in this article), see Mega Digital's YouTube ad benchmarks report, which draws on Google-sourced data and campaign averages across industries, and Store Growers' YouTube ads benchmark breakdown. Both confirm the same underlying pattern: categories with higher commercial intent command higher CPM.
Factor 4 — Content Type
- Long-form content (20+ minutes): better CPM (more ad placements)
- Short-form content (TikToks, Shorts): lower CPM (fewer ads, less revenue)
Special Cases: Category Variations
The sub-category figures below are estimated from publicly shared monetization screenshots, creator AMAs, and community-reported earnings reviewed between 2024–2026 — mostly from US and other Tier-1 creators, not India-specific. They're not pulled from a single source or official YouTube data, and they sit on a different baseline than the India table above, so don't compare them directly.
Finance Category Deep Dive
Finance is generally among the highest-earning YouTube niches, because advertisers in financial services often have some of the highest acquisition budgets.
| Sub-category | CPM | Notes |
|---|---|---|
| Crypto/Bitcoin | $15 – $20 | Highest CPM (risky but high value) |
| Stock trading | $12 – $15 | High CPM, high demand |
| Real estate investing | $10 – $12 | Premium advertiser budget |
| Forex trading | $8 – $10 | Niche but profitable |
| General finance tips | $8 – $12 | Variable CPM |
| Personal finance | $6 – $8 | Lower CPM (general advice) |
Tech Category Deep Dive
| Sub-category | CPM | Notes |
|---|---|---|
| Software reviews (B2B) | $8 – $12 | Highest CPM (business tools) |
| Apple products | $7 – $9 | Premium brand advertisers |
| Gaming tech | $5 – $7 | Enthusiast audience |
| General tech news | $5 – $7 | Broad appeal |
| Phone reviews | $4 – $6 | High volume, lower CPM |
| DIY tech tutorials | $3 – $5 | Less premium advertisers |
Entertainment Category Deep Dive
| Sub-category | CPM | Notes |
|---|---|---|
| Movie reviews | $5 – $7 | Premium content |
| Celebrity news | $4 – $6 | Entertainment industry ads |
| TV show commentary | $3 – $5 | Dependent on content |
| Random challenges | $1 – $3 | Low-value content, low CPM |
| Reaction videos | $2 – $4 | Variable quality, low CPM |
Limitations of This Research
Although I spent considerable time researching publicly available creator earnings and monetization data, these estimates are not official YouTube figures. YouTube doesn't publish category-specific RPM values, and actual earnings vary from channel to channel.
The India table and the sub-niche deep-dive tables also come from different sample sets and audience baselines, as noted above — treat each as internally consistent for comparing categories against each other, rather than cross-comparing the two tables directly.
The RPM ranges in this article are calculator inputs for scenario planning, not verified market estimates. Audience country, advertiser demand, video length, seasonality, revenue mix and the ads actually served can all influence a channel's RPM.
Frequently Asked Questions
1. Which YouTube category has the highest RPM? Within this estimate model, Finance has the highest India upper bound at $3.50 for videos longer than 8 minutes. This is an illustrative assumption, not a measured India-wide average. Actual RPM varies by audience, revenue mix, advertiser demand, and video performance.
2. Does YouTube officially publish RPM for each category? No. YouTube does not publish official RPM values by category. The estimates in this article are based on publicly available creator earnings, monetization reports, and advertising trends collected while developing the YTKits Revenue Estimator.
3. Why do two channels in the same category have different RPM? Two channels in the same niche can earn very different RPM because YouTube monetization depends on multiple factors, including:
- Audience country
- Video duration
- Advertiser demand
- Viewer engagement
- Content topic
- Seasonality
For example, two Education channels may have completely different RPM if one focuses on programming while the other covers general educational topics.
4. Does video length affect YouTube RPM? Videos of at least 8 minutes can be eligible for mid-roll ad slots, which creates additional opportunities for ads to serve. It does not ensure that an ad will serve or that RPM will rise. YouTube decides whether to show an ad, and viewer experience still matters.
5. Which countries usually have higher YouTube RPM? Creators targeting audiences in the United States, Canada, the United Kingdom, and Australia often earn higher RPM than creators whose audience is primarily in India, because advertisers typically spend more in those markets.
6. What is the difference between RPM and CPM?
- CPM (Cost Per Mille) is what advertisers pay for 1,000 ad impressions before YouTube's revenue share.
- RPM (Revenue Per Mille) is what creators earn per 1,000 views after YouTube's revenue share, including all eligible revenue sources. For creators, RPM is usually the more useful metric when estimating earnings.
7. Can I increase my YouTube RPM? RPM is an outcome rather than a setting. A creator can review factors associated with the revenue mix, including:
- Creating longer, high-retention videos
- Serving topics for which the creator has useful knowledge
- Making content that genuinely serves the intended regional or language audience
- Publishing advertiser-friendly content
- Improving overall viewer engagement
8. Are the RPM values in this article guaranteed? No. These are estimated RPM ranges, not guaranteed earnings. Actual RPM can vary depending on audience demographics, advertiser competition, video performance, seasonality, and many other factors.
Conclusion
While building the YTKits Revenue Estimator, I found that category was insufficient for describing a revenue scenario. Audience location, video format, advertiser demand, season and revenue mix also need to be considered.
That is why the article shows ranges and exposes their limitations. The figures help users explore how an assumption changes a calculation; they should not be quoted as measured industry averages.
If you're choosing a niche, don't chase the highest RPM alone. A Finance channel may earn more per thousand views than a Gaming channel, but long-term success still depends on creating content you can consistently produce and that your audience genuinely values.
I hope this research helps you better understand how YouTube monetization works and gives you a more realistic starting point when estimating potential earnings. As I continue improving the YTKits Revenue Estimator, I'll keep updating these estimates with new publicly available monetization data to make them as useful as possible.